I have Nagios set up and working with PNP4Nagios. They work great.
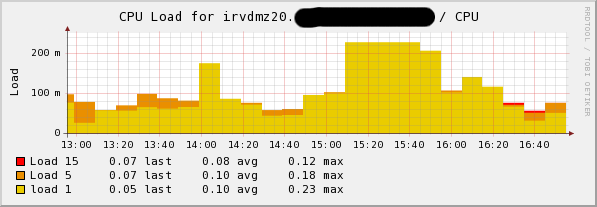
A question was recently raised to me on the CPU graphing. In displaying the CPU load the load is marked by 100m, 200m.
I’d really like to display the CPU load in ‘%’.
Here’s a sample of the graph;