Hello,
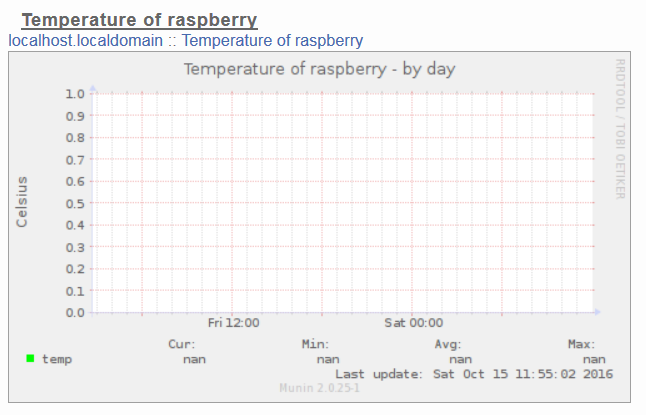
I am trying to get back the temperature of my RaspberryPi 3 but I got a problem with the y axis because it’s between 0 and 1.
In fact, when I am executing the script, I got back a temperature between 45 and 50 degrees. But, I can’t see anything on the graph.
This is the script :
VCG=/opt/vc/bin/vcgencmd
WARN=70
CRIT=75

if [ "$1" = "autoconf" ]; then
        if [ -x $VCG ]; then
                echo yes
                exit 0
        else
                echo no
                exit 1
        fi
elif [ "$1" = "config" ]; then
        echo "graph_title Pi Temperature"
        echo "graph_args --base 1000"
        echo "graph_vlabel Celsius"
        echo "graph_category sensors"
        echo "graph_info This graph shows Temperature data from $LOCATION"
        echo "temp.label temp"
        echo "temp.type GAUGE"
        echo "temp.info Celsius."
        echo "temp.colour 00ff00"
        echo "temp.warning $WARN"
        echo "temp.critical $CRIT"
        exit 0
fi

temp=$($VCG measure_temp | cut -d'=' -f2 | cut -d"'" -f1)
echo "temp.value $temp"
I think that the problem cames from “graph_args --base 1000” but when I changed the base, I got the same units on the y axis.